


Florida Probe — computerised measurement of gum health
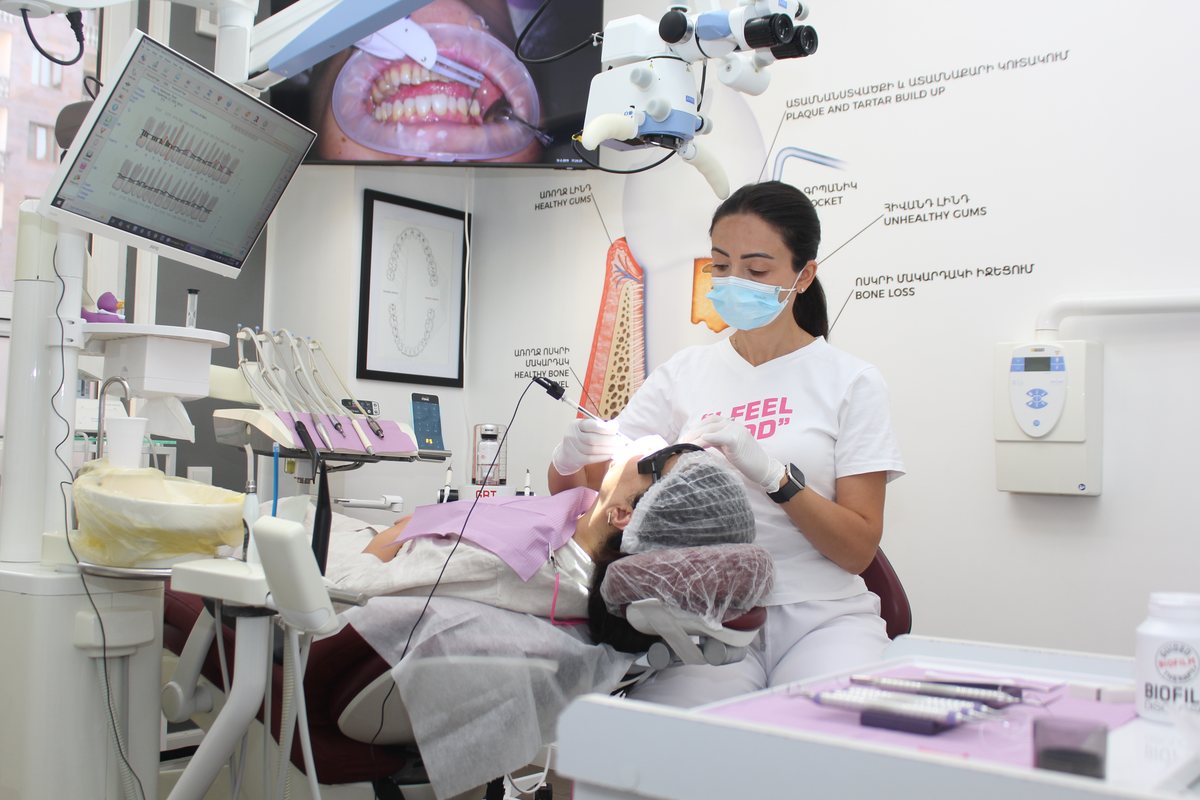
Periodontal disease does not hurt until it is advanced. It shows up as numbers: pocket depth, bleeding, bone loss. The Florida Probe measures those numbers at a constant force and records them in the computer — so that at the next visit there is something to compare against.
Why the measurement decides everything
Treatment outcome is judged by re-measuring the same points, not by impression.
The international endpoint of periodontal therapy is numerical: at the end of treatment there should be no pockets deeper than 4 mm that bleed on probing, and no pockets of 6 mm or more. That endpoint (European Federation of Periodontology S3 guideline, 2020) cannot be applied unless the baseline was recorded site by site. Without a baseline, “it looks better” stays an opinion.
Without Florida Probe measurements we cannot objectively assess the result of treatment. We may see that the gum looks healthy, but we cannot prove at which site the condition improved and at which it got worse.
What the Florida Probe is
A computerised periodontal probe and diagnostic software, developed inside a university research programme.
- OriginThe probe was developed at the University of Florida in 1985 at the request of the US National Institutes of Health, and the system was released in 1987. The first clinical description was published in the Journal of Clinical Periodontology in 1988.
- Constant forceThe probe always presses on the tissue with the same force — 15 grams. With a hand probe, force varies between clinicians and even within the same clinician over a working day. Force variation is the single largest source of measurement error.
- PrecisionEach reading is recorded electronically to 0.1–0.2 mm, rather than by reading probe markings by eye.
- Automatic recordingThe value enters the computer at the press of a foot switch. Nobody calls the number out loud and nobody writes it down — two steps where errors normally creep in.
- Comparison over timeThe software stores every visit and shows where depth decreased, where it stayed the same, and where it increased.
- International useThe Florida Probe is used as the measurement standard in clinical research, including multi-centre protocols registered on ClinicalTrials.gov — precisely because the reading depends so little on the operator.
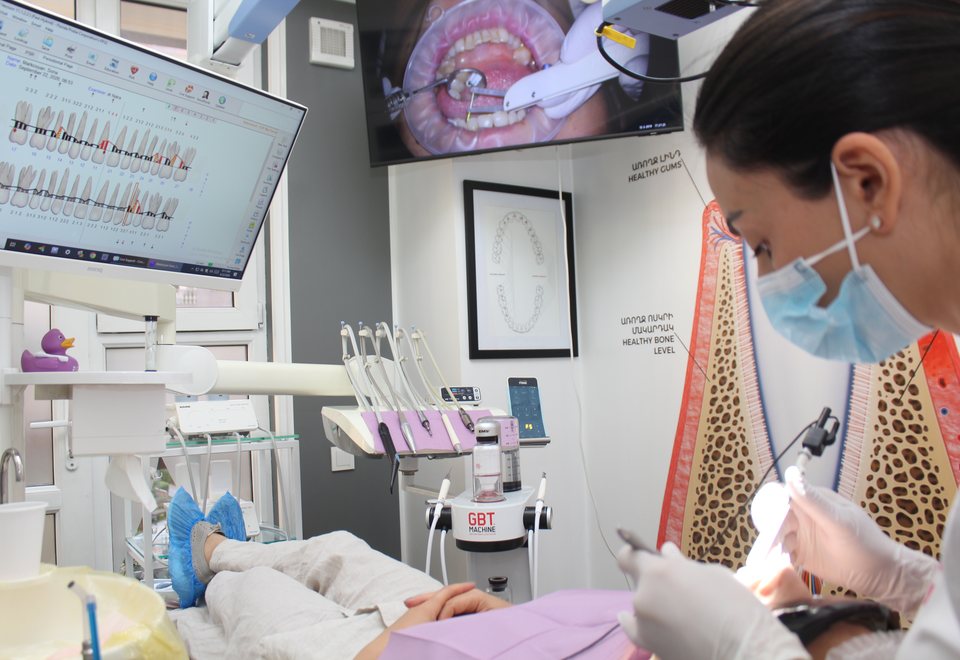
The reading appears on screen in real time — for every site of every tooth.
What we actually measure
Pocket depth is only one of the numbers. The system records six different parameters at the same time, for every surface of every tooth.
Pocket depth
From the gingival margin to the base of the pocket, in millimetres, at six sites around each tooth. Anything deeper than 4 mm is beyond the reach of home cleaning.
Recession and attachment level
How far the gum has receded and how much connective attachment has been lost. Attachment level is the true extent of disease: a pocket can become shallower simply because the gum has receded.
Bleeding on probing
Bleeding indicates inflammation. Its absence is the most reliable predictor of stability, with a negative predictive value of around 98%.
Suppuration
Pus discharging from a pocket is recorded as a separate finding. It signals active infection and changes the urgency of treatment.
Tooth mobility
Assessed and recorded for each tooth, to judge how much bony support has been lost.
Furcation involvement
Involvement of the root separation zone in multi-rooted teeth — a separate finding that determines the prognosis of the tooth.
Why the result barely depends on the clinician
Two clinicians with hand probes can measure the same pocket differently. The system removes the main causes of that difference.
- Force is fixed — 15 grams, regardless of who is measuring and how far into the working day it is.
- Reading is electronic — Nobody estimates “about 5 mm” from the markings on a probe.
- Recording is automatic — A press of the foot switch and the number is in the chart. Dictation and handwriting errors are eliminated.
- The protocol is identical — Every tooth, six sites around each one, in the same order — at every visit.
The literature is measured about this: a constant-force probe does not outperform a well-trained clinician with a hand probe in every study. What it does remove is force variation, visual reading and dictation error — the three factors that most interfere with comparing one visit against another.
How the assessment runs
A complete periodontal chart is produced in a single appointment.
Preparation
The dentition is examined and missing teeth, implants and crowns are entered into the system.
Probing
Six sites around each tooth — roughly 170–180 readings for a full dentition. The system speaks each number out loud.
Additional findings
Bleeding, suppuration, mobility, furcation and recession are recorded in the same pass.
Plaque chart
Plaque and calculus distribution is recorded separately, by surface and by tooth group.
Diagnosis
The software calculates the summary figures: depth distribution, percentage of bleeding sites, plaque index.
Handover
The patient receives the printed chart with their own numbers, and those numbers become the basis of the treatment plan.
Real charts from our practice
Two documents every patient receives after the assessment.
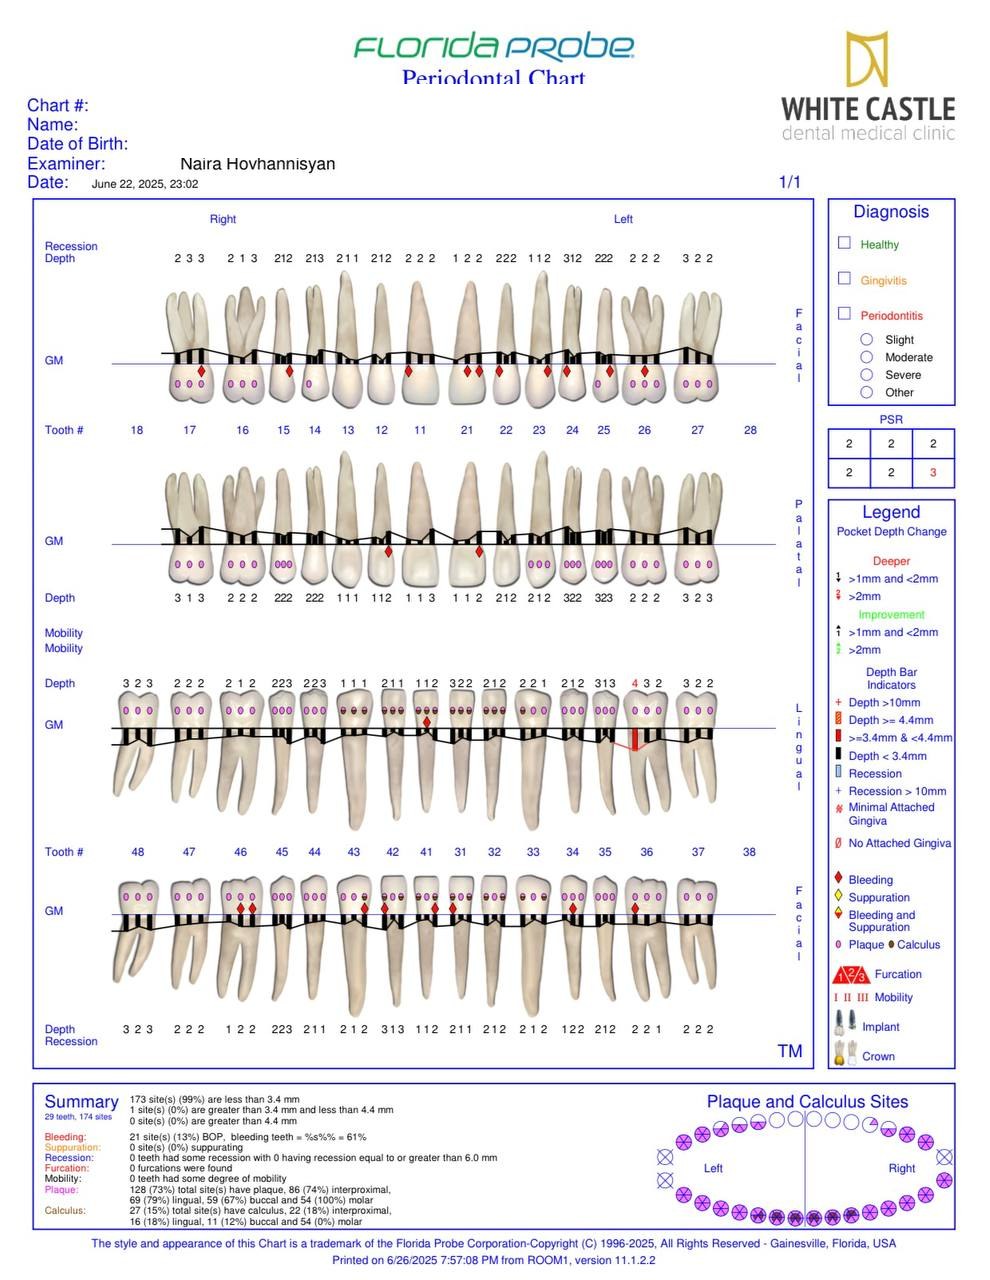
Periodontal chart
The whole dentition, site by site. Red markers show bleeding and suppurating sites; the scale shows pocket depth. The summary at the bottom states what percentage of all measured sites is within normal limits and how many sites are deeper than 4 mm.
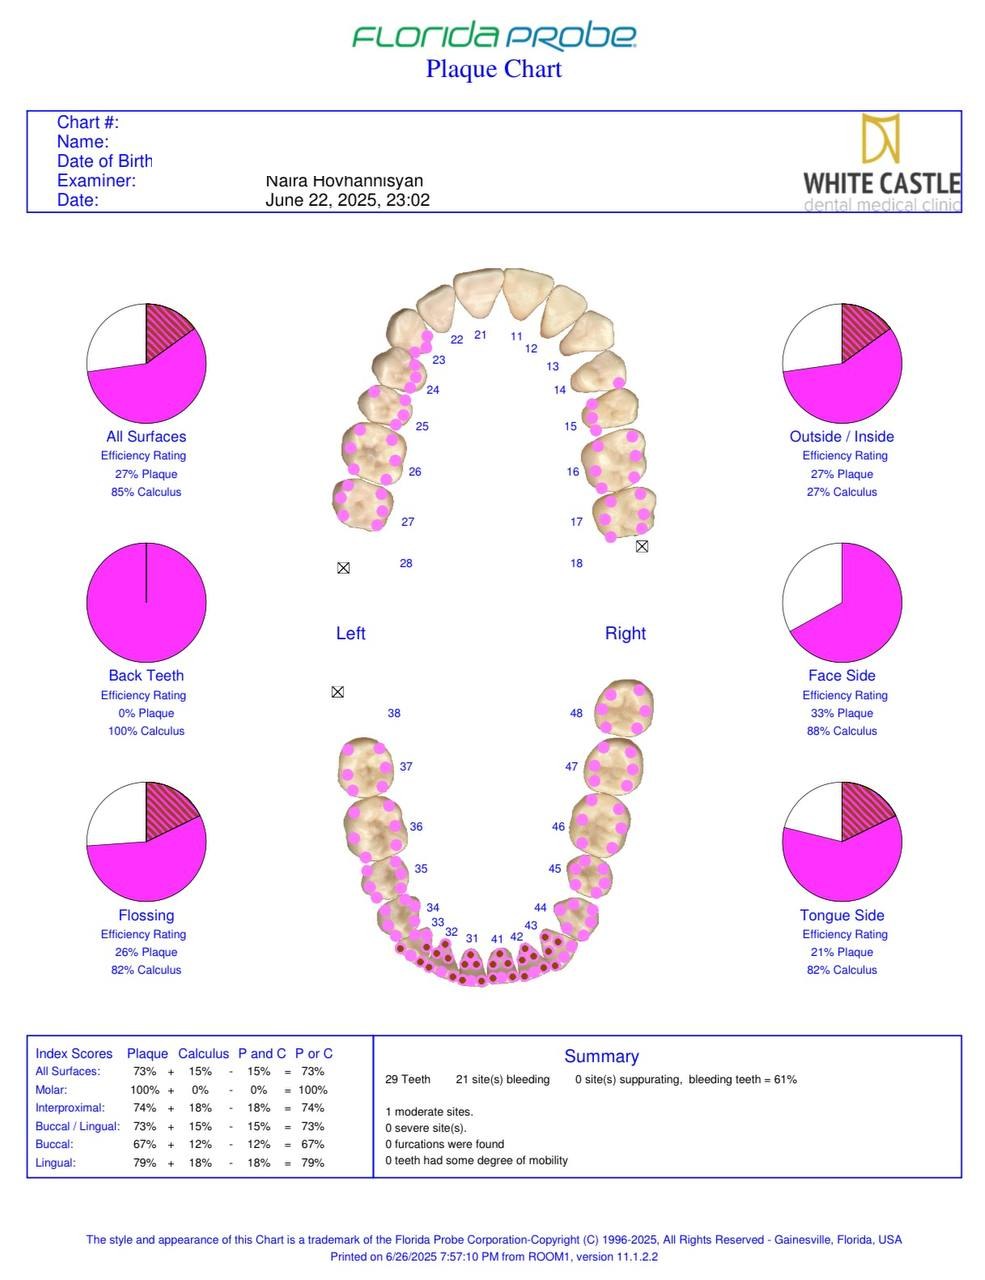
Plaque chart
Plaque and calculus distribution by surface. This chart shows which zones are being missed by daily care — interdental spaces, lingual surfaces, back teeth. It becomes the basis of personalised hygiene coaching.
How we judge improvement
The measurement is repeated to the same protocol — and the system compares the two visits.
Baseline
A full chart is recorded before treatment. This is the point everything else is compared against.
Treatment
Non-surgical periodontal therapy under the GBT protocol, subgingival instrumentation, hygiene coaching.
Re-evaluation
After 6–8 weeks the measurement is repeated. The system shows the change at each site in millimetres.
Decision
If bleeding pockets deeper than 4 mm or pockets of 6 mm and more remain, we move to the next step. If not, the patient enters supportive care.
Maintenance
Re-measurement every 3–6 months. Stability means fewer than 10% of sites bleed on probing.
This sequence follows the S3-level clinical practice guideline of the European Federation of Periodontology for the treatment of stage I–III periodontitis.
The patient hears their own numbers
The system reads every measurement out loud.
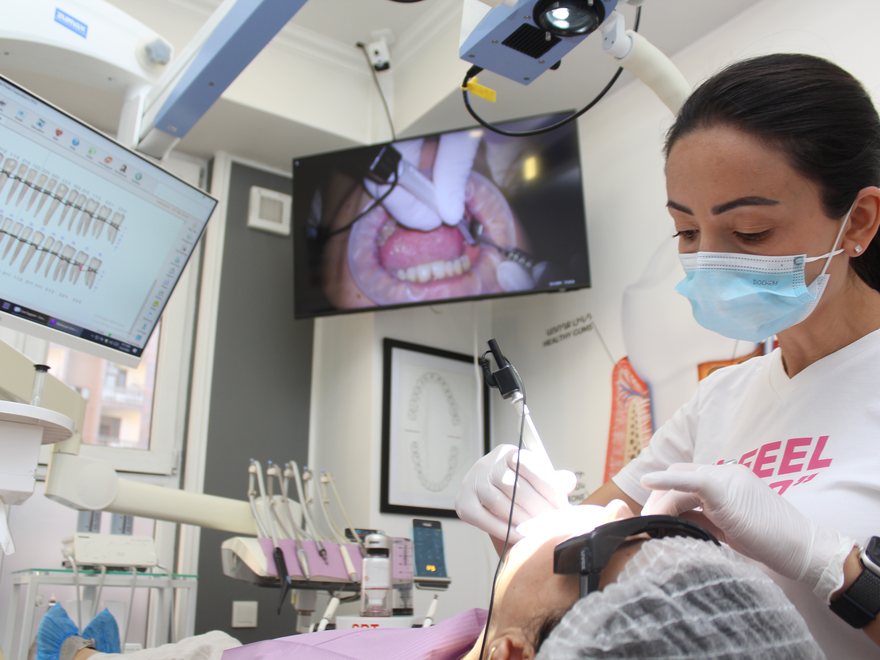
- The problem becomes tangibleWhen a patient hears “two, three, two” and then “six”, they understand where the problem is without being told.
- No persuasion involvedThe measurement is taken without commentary. The numbers are the same for everyone and do not depend on what we are about to recommend.
- The comparison is visibleAt the next visit the patient sees both of their charts side by side and judges the change themselves.
- Responsibility is sharedThe plaque chart shows which zones are being missed at home. It is not a reproach but a personal map.
Who performs the assessment
The Florida Probe is operated by Dr Naira Hovhannisyan, who leads the periodontal side of the clinic.
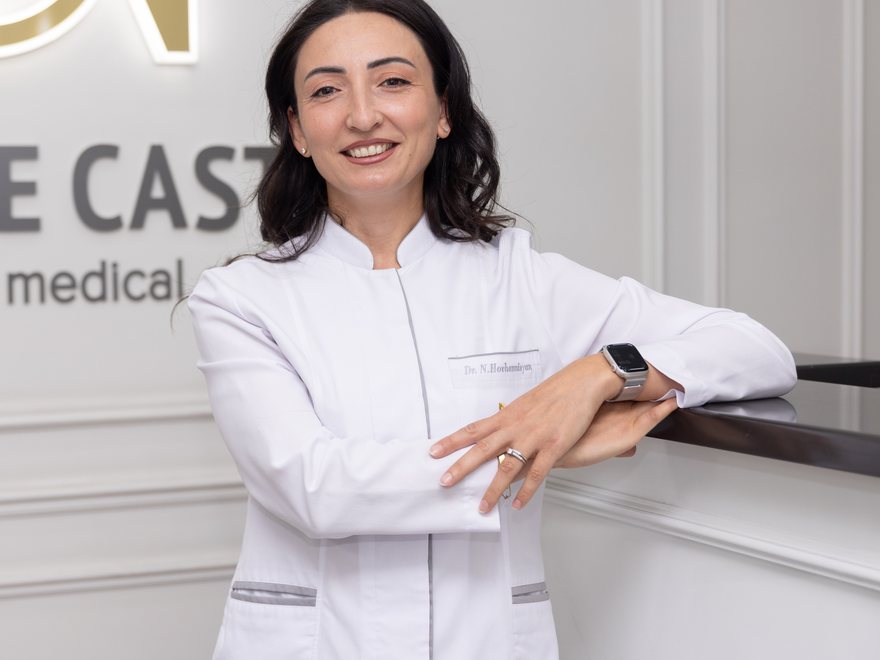
Dr Naira Hovhannisyan
Dentist, lead for periodontal treatment
Dr Hovhannisyan has worked at White Castle since 2010. Her professional focus is non-surgical periodontology — treating gum disease without surgery, with a measurable result. She both treats and teaches in this field.
When it is indicated
The assessment is not reserved for patients with complaints.
Bleeding gums
Blood when brushing is not normal. It is the first and most commonly ignored sign of inflammation.
Before implant treatment
Untreated periodontitis is an established risk factor for implant loss. The assessment comes before planning.
Before orthodontic treatment
Moving teeth through inflamed periodontal tissue accelerates bone loss.
Before prosthodontic work
Crowns and bridges are supported by gum and bone, not by the tooth alone.
Diabetes
The relationship between periodontitis and diabetes runs both ways: worsening one worsens the other.
Smoking
In smokers, gum bleeding is masked. Depth measurement becomes the only reliable indicator.
Frequently asked questions
Does it hurt?
The constant 15-gram force was chosen precisely to keep discomfort to a minimum. Inflamed pockets may be sensitive, but it is no more uncomfortable than conventional probing, because the force never exceeds the set value.
How long does it take?
A full chart takes around 20–30 minutes, depending on the number of teeth and the clinical situation.
Is it done at every appointment?
No. After the baseline assessment it is repeated at re-evaluation, 6–8 weeks later, and then every 3–6 months as part of supportive care.
Does it replace X-rays?
No. Probing measures the soft tissue and attachment; radiographs show bone level. The two complement each other and the plan is built on both.
Can I take the chart with me?
Yes. The printed chart is yours. You can show it to any other clinician, in Armenia or abroad.
What does “stable” mean?
No pockets deeper than 4 mm that bleed, no pockets of 6 mm or more, and fewer than 10% of all measured sites bleeding on probing.
Find out your numbers
The assessment takes 20–30 minutes. You leave with your own periodontal chart — the document every future visit will be compared against.
6/1 Nikoghayos Adonts St., Yerevan · +374 12 336699